
Interactive Tool
Reef Hive
A digital twin of Wakatobi's protected reef system. Every reef cell, every monitoring event, mapped in three dimensions.
How To Use It
Navigate the Reef
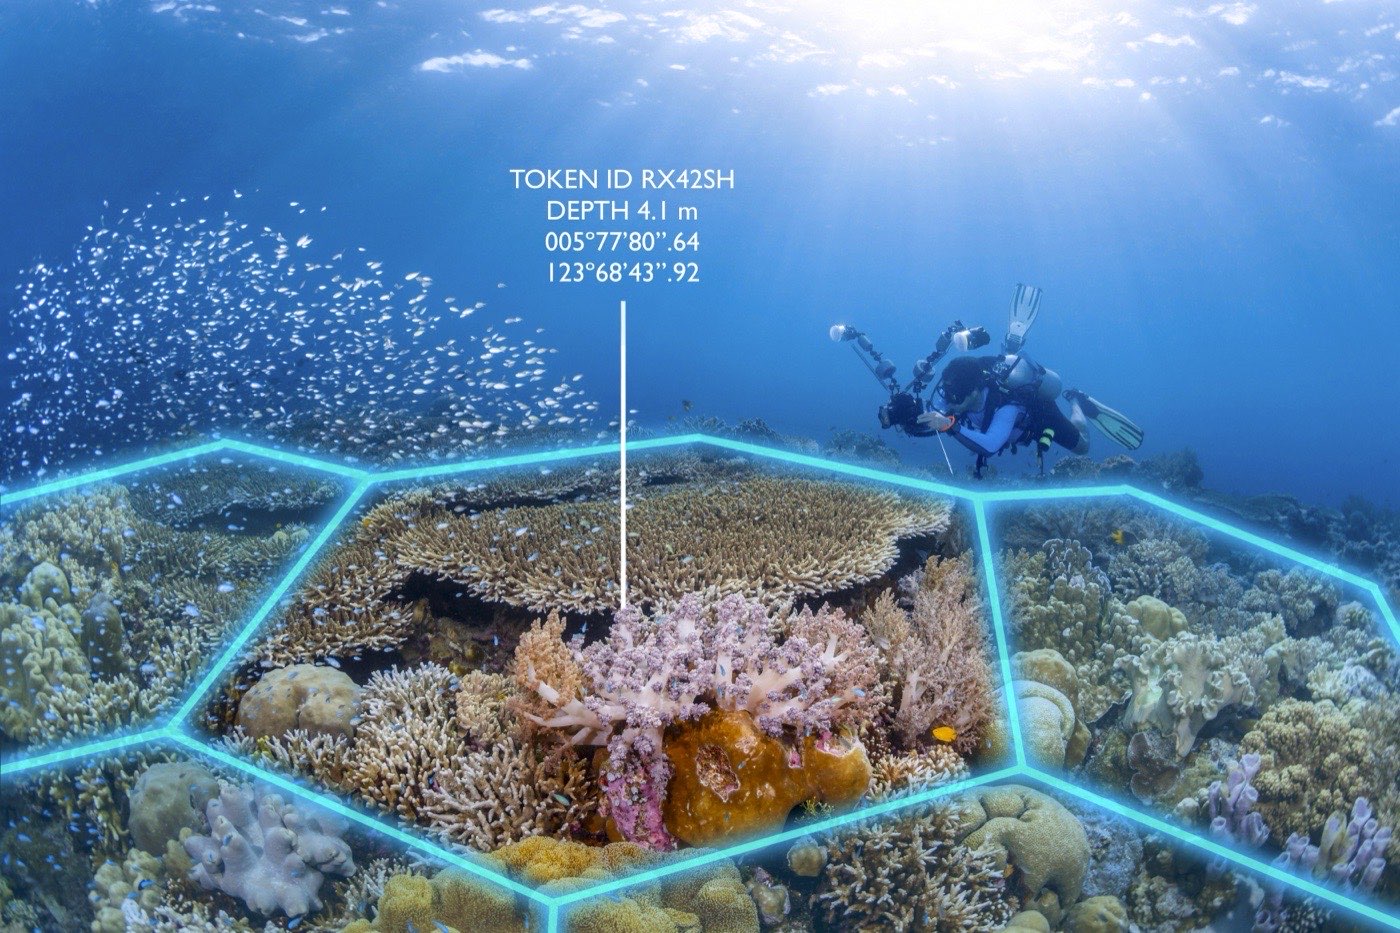
The Reef Hive visualises the hexagonal grid of reef cells that underpins Reefonomics' monitoring methodology. Each cell represents a precisely defined area of reef habitat — the building blocks of measurable conservation outcomes.
Cells are colour-coded by health status, updated as monitoring events complete. Click any cell to view its history: photo surveys, acoustic recordings, eDNA results, and ocean chemistry data.
For partners, this is the reporting interface — the live picture of reef health, at scale, over time.
Companion App
Meet FinLog
Reef Hive shows the bigger picture. FinLog captures individual reef moments — sightings, species, stories — from divers and local observers, feeding citizen science data back into the monitoring programme.
Explore FinLog →See it in your partnership
Partners get bespoke access to Reef Hive — tracking their allocated reef cells, outcomes, and impact over time.
julia@reefonomics.comExplore Partnerships